Loading...


Let our Amazon experts show you how to leverage the power of ZonGuru to smash your sales goals. You’re invited to a 15-minute Rocket Demo so you can see the ZonGuru tools first-hand.
Book your seat now!
The failure and success of a listing or a label depend on its business performance. Therefore, one needs to be very hands-on with monitoring the business performance of clients’ listings and accounts.
However, keeping tabs on business performance through the Seller Central account is a tall order. You have to process loads of information, juggle a lot of numbers, and run multiple calculations to come up with key performance indicators.
This manual appraisal of business performance becomes virtually impossible for anyone taking care of multiple seller accounts and listings in bulk.
What if there was a one-window option that lets you monitor the business performance of entire seller accounts as well as individual listings?
The Business Metrics option on the main menu of ZonGuru is that crystal ball that lets you monitor the business performance of labels and listings in the easiest possible manner.
Let’s see how it works.


As soon as the Amazon seller account connects with ZonGuru, all the key business performance information will be processed and displayed in the Business Dashboard section. Meanwhile, all the ASINs listed through that seller account will be stacked in the My Products section.
First, you need to open the My Products section and enter some values to make the most of the Business Dashboard.


In the Stats column in the middle, you need to define these parameters to get the most accurate business analytics.
If you’re using a 3PL service, you also need to mention these details.
Entering those values is as easy as it gets. Simply click on the value that you want to enter e.g. if you want to enter Cost of Goods Sold, just click on COGS in the Stats column of the respective SKU.
That’s how it goes.


Similarly, mention the manufacturing time and 3PL values.
Mentioning COGS and production lead times helps the tool to carry out accurate business reporting and issue timely inventory reorder prompts.
Once you’re done entering the relevant values on the My Products page, click on Business Dashboard to see the listings/label of the connected seller account for multiple business KPIs.
When you connect a seller account to ZonGuru, Business Dashboard scans its entire portfolio and gives you business analytics for all its SKUs/ASINs/listings.


All these different sections on the Business Dashboard show different aspects of business performance in visual and tabular form.
Before scanning the dashboard for business performance and insights, you can set various filters to streamline your analysis.
You can set those filters from the top of the page.

There are many ways you can use this interactive and easy dashboard to monitor business performance on Amazon.
The top horizontal widget on Business Dashboard gives you a quick overview of the business performance of a label/ASIN.

Here, the filters are set for the last 30 days, for all markets, and all active products (ASINs).
The widget shows:
Items sold: The number of total units sold by the seller/label across all SKUs in the last 30 days.
Gross revenue: Total sales revenue in the last 30 days. This number can be used to assess a seller’s/label’s ability to sell products and generate revenue.
Net Margin: It is the percentage of margin after deducting all the business-related expenses including taxes and fees. In short, it is a profit percentage and shows the profitability of a business. If this figure is higher than 25%, you can term an ASIN/label a viable venture.
Net Profit: It is the profit that the seller is pocketing after taking care of all the working expenses.
Business Value: It is the estimated value of a business (including the unsold inventory) for which you can flip a client’s brand/label. The default estimation is carried out at 2.5 multiples of net annual profit. However, you can customize this multiple based on business size, niche, and other factors.
You can also choose a particular ASIN and find out all those KPIs for it as well.
So, within a glance, you can find
The two-column window below the main overview widget is where you can look at the expense breakdown of your client’s private label/listing.
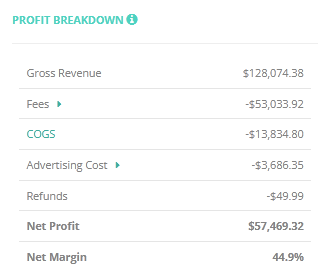
After Gross Revenue, you have the Fees section that expands and shows further breakdowns of different Amazon Fees. In short, you can see the accumulated Amazon fees for different services (FBA, referral, storage, etc) for an ASIN or an entire label within a single column, and that too without running any manual calculations.

After Fees, there is a COGS figure. ZonGuru calculates the cumulative COGS for an ASIN/label after you enter its value in the My Products section.

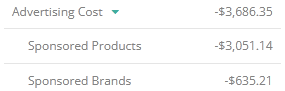
After COGS, you can look at the PPC expense breakdown for the ASIN/label by clicking on the Advertising Cost drop-down column.
After the PPC breakdown, you can see the outlay that an ASIN/label has incurred in terms of returns. This value also helps in determining the customer satisfaction index of an ASIN/label (higher the refund amount, lower the customer satisfaction index).

Charts and graphs often give an unsophisticated view of business performance. Many clients prefer to look at the visual summary of business metrics rather than looking at complex numbers. You can get the visual summary of business performance for your clients through this interactive chart, named DAILY SALES (LAST 30 DAYS) on Business Dashboard.

On this graph, you can map out different data points on the time axis (the period you set before using the Dashboard). These data points have color-coding that makes graphs more understandable e.g. light green for Gross Revenue and yellow for Net Profit.
Go to the setting icon on the top to include and exclude the data points you want to see in the chart. Check the boxes of the data points you want to see on the graph.

Let’s say you want to map out gross revenue and net profit for the last 30 days. Check the relevant boxes and the tool will dispense you the required chart.


Similarly, you can relate the gross revenue with the advertising cost.

It is always essential to know how much revenue an ASIN/label is generating from ads. Also, how much ad expense is translating into actual sales is a good indicator of the success/failure of a PPC campaign. The Sales Breakdown section (represented by a pie chart) on the Business Dashboard gives you a sneak peek into those details.

The pie chart shows how much sales of an ASIN/label are coming through organic traffic and how much of it is driven from paid channels. Then you also get to find out the Actual Cost of Sales (ACOS) and Actual Cost of Total Sales (ACOTS) for a label/ASIN without calculating it yourself.
Both ACOS and ACOTS tell you how you are doing with your advertising strategy for the given ASIN/label: higher ACOS and ACOTS percentages mean less successful PPC results and vice versa.
So, you find out about the success/failure and general performance of your PPC work for a label/ASIN within seconds. You get to know this important business insight without compiling and computing data points from different sources.
Also, if you look at the pie chart, you can see the slice of organic sales as well. Its size can be a good indicator of the overall optimization of the given label/listing.
If you are handling multiple ASINs for a single client, you may need to keep track of SKUs that are doing great and the ones that are lagging behind. The Business dashboard gives you a quick roundup of products doing best and worst based on multiple business KPIs.

Here you can see the products lined up from Best to Worst performing for Revenue, Margin Rate, Net Profit, Refund Rate, ACOS, ACOTS, ROI, and Review Rate.
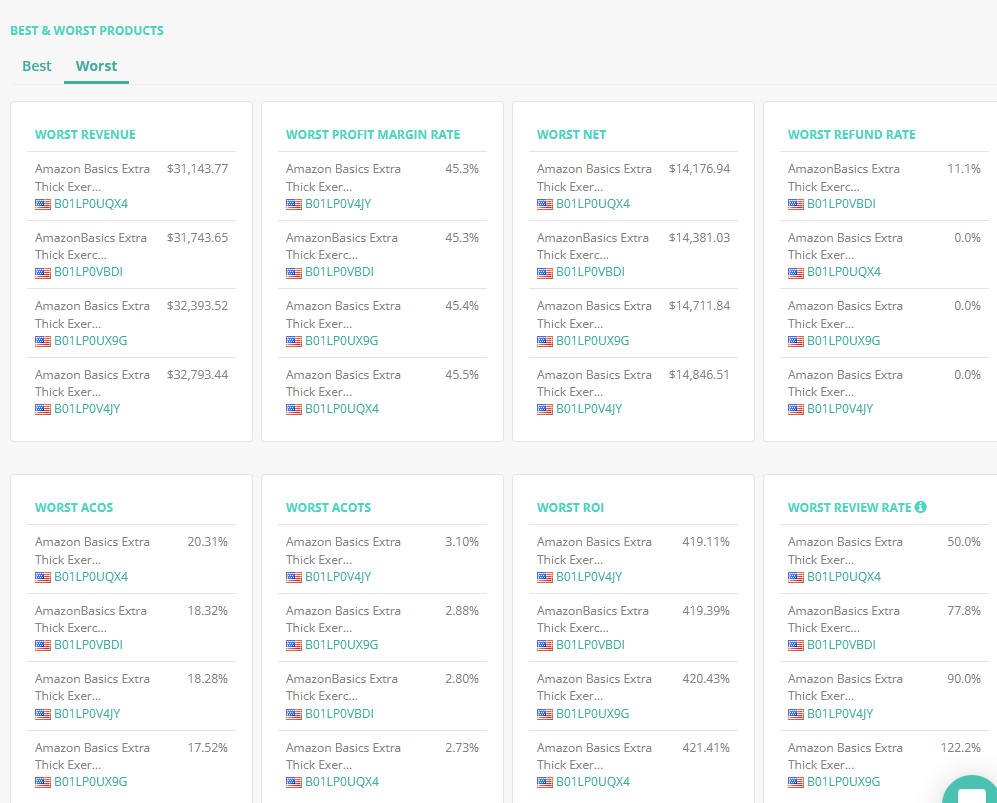
You can also set it from Worst to Best.
To sum it up, with Business Dashboard, you can unearth different business insights for your clients without getting sucked into spreadsheets and different software. You find all the most relevant business performance information for a label/ASIN on a single dashboard that is processed and ready to be shared with clients.
Discover opportunities. Maximize your sales. Grow your Amazon business!

Free score in 2 minutes. See how Amazon's AI reads your listing and what to fix.
 Run my Free Score
Get started with ZonGuru, access all the tools with a FREE trial.
.webp) Start FREE Trial
Start FREE Trial