Loading...


Let our Amazon experts show you how to leverage the power of ZonGuru to smash your sales goals. You’re invited to a 15-minute Rocket Demo so you can see the ZonGuru tools first-hand.
Book your seat now!
Quick question: which Brand Analytics report tells you whether Amazon's AI can read your listing?
Take your time. Open Seller Central if you want. Walk all eight dashboards — Search Query Performance, Top Search Terms, all of them.
There isn't one. Every report in the suite reads the keyword engine's history, and the keyword engine is no longer the only system deciding who gets found. Since May, an AI assistant sits in the search bar itself, answering shoppers before they ever see a results page — and it doesn't file a report anywhere.
This article covers what Brand Analytics measures well, which reports deserve your time, and how to measure the engine it can't see.
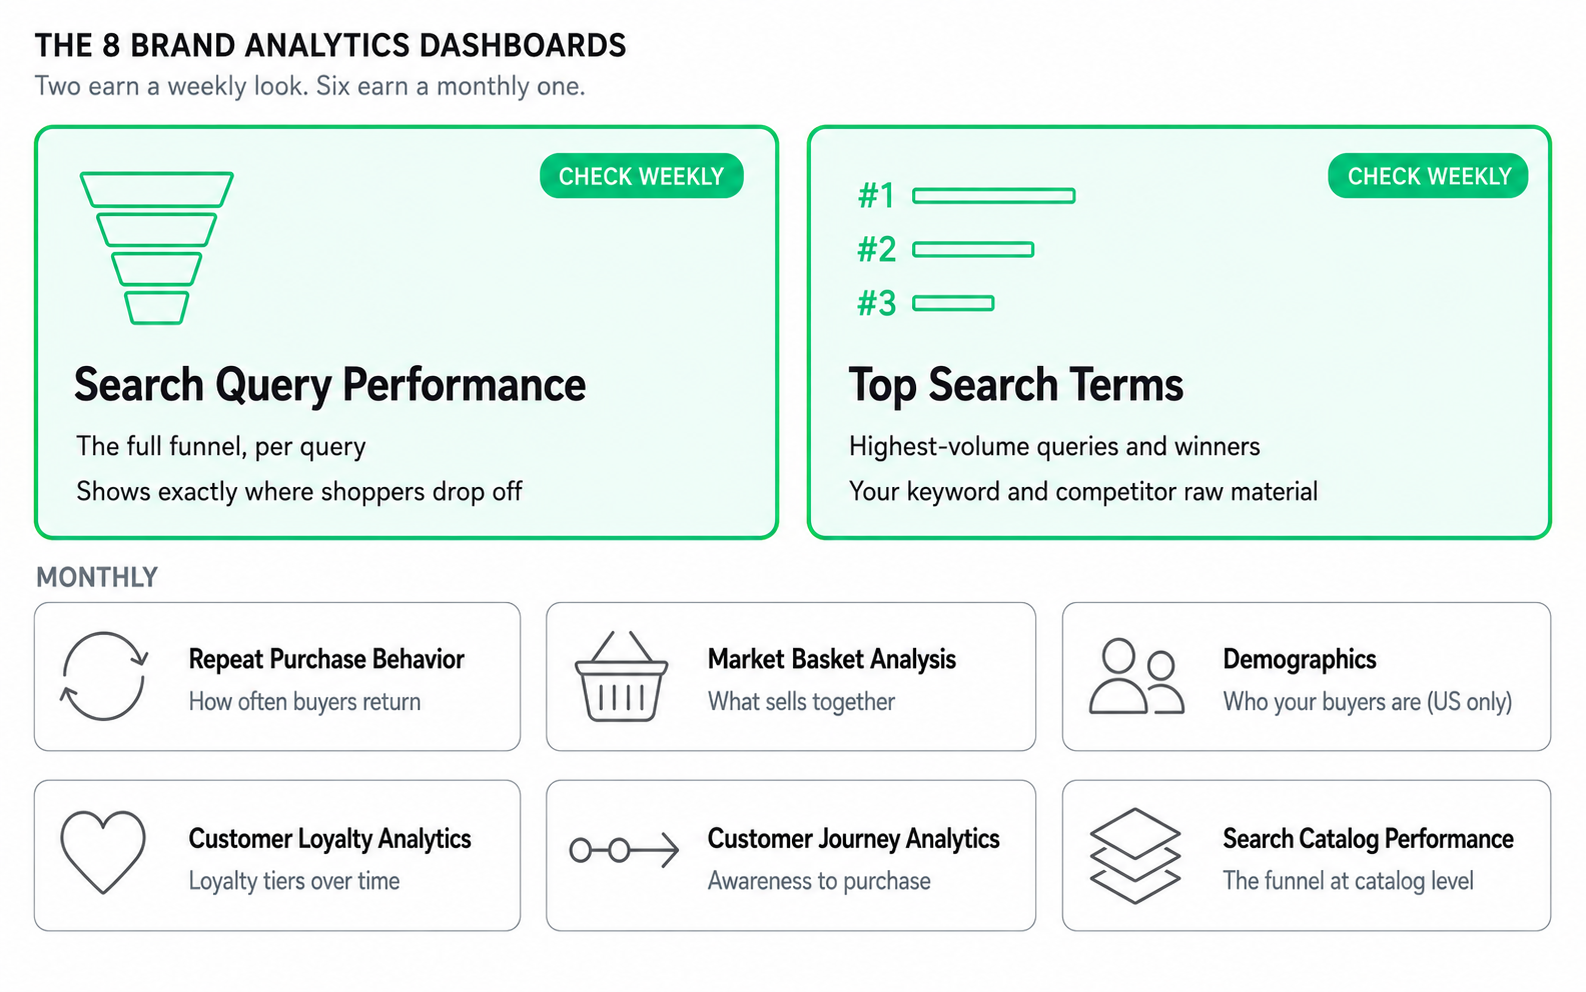
Brand Analytics is a free reporting suite for brand owners enrolled in Brand Registry on a Professional selling account. It currently includes eight dashboards.
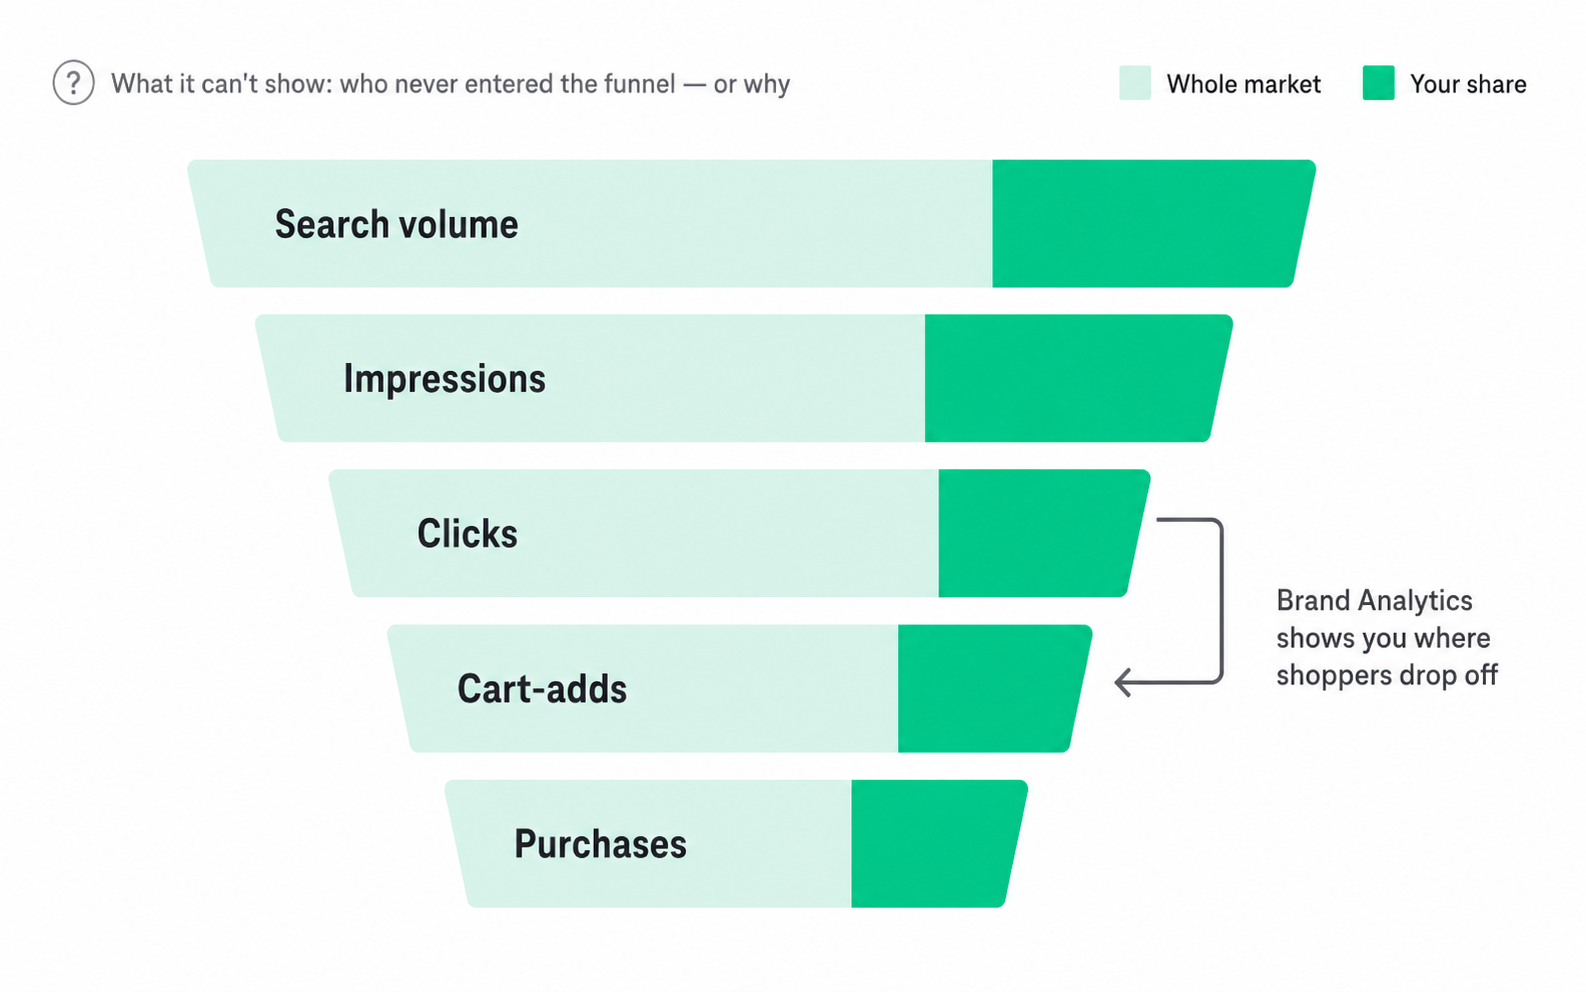
Search Query Performance is the one to open first, and most sellers underuse this report. Pick a search term and it walks the funnel: search volume, impressions, clicks, cart-adds, and purchases. Each step shows the whole market's total, your brand's count and share, and an ASIN-level view. If clicks are strong but cart-adds are weak, you can see exactly where shoppers drop off. That pattern usually has one of three causes: your price looks worse on the product page than it did in the search results, a fresh negative review is sitting at the top of your review stack, or images three through five aren't carrying the benefit story your title promised. The report finds the leak. Those are the first three places to look for it.
Attribution warning: One warning before you trust the numbers. SQP attributes a purchase to a query only when the purchase lands within roughly a day of the search. A shopper who searches Tuesday, parks your product in the cart, and checks out Thursday from the mobile app falls out of that keyword's funnel entirely. This is why SQP never reconciles with your Business Reports or your 7- and 14-day PPC attribution - and why it shouldn't. Different windows, different questions. Read SQP for funnel shape, not absolute counts.
The other seven fill in the picture:
Each is a record of how shoppers searched for and bought your products in the past. All eight share one trait - that is keyword-engine behavior, captured after the fact.
Access is simple. You need a trademark (registered, or a pending application), Brand Registry enrollment, a Professional selling account, and brand-representative permissions. The reports live under the Brands menu in Seller Central. There is no separate fee.
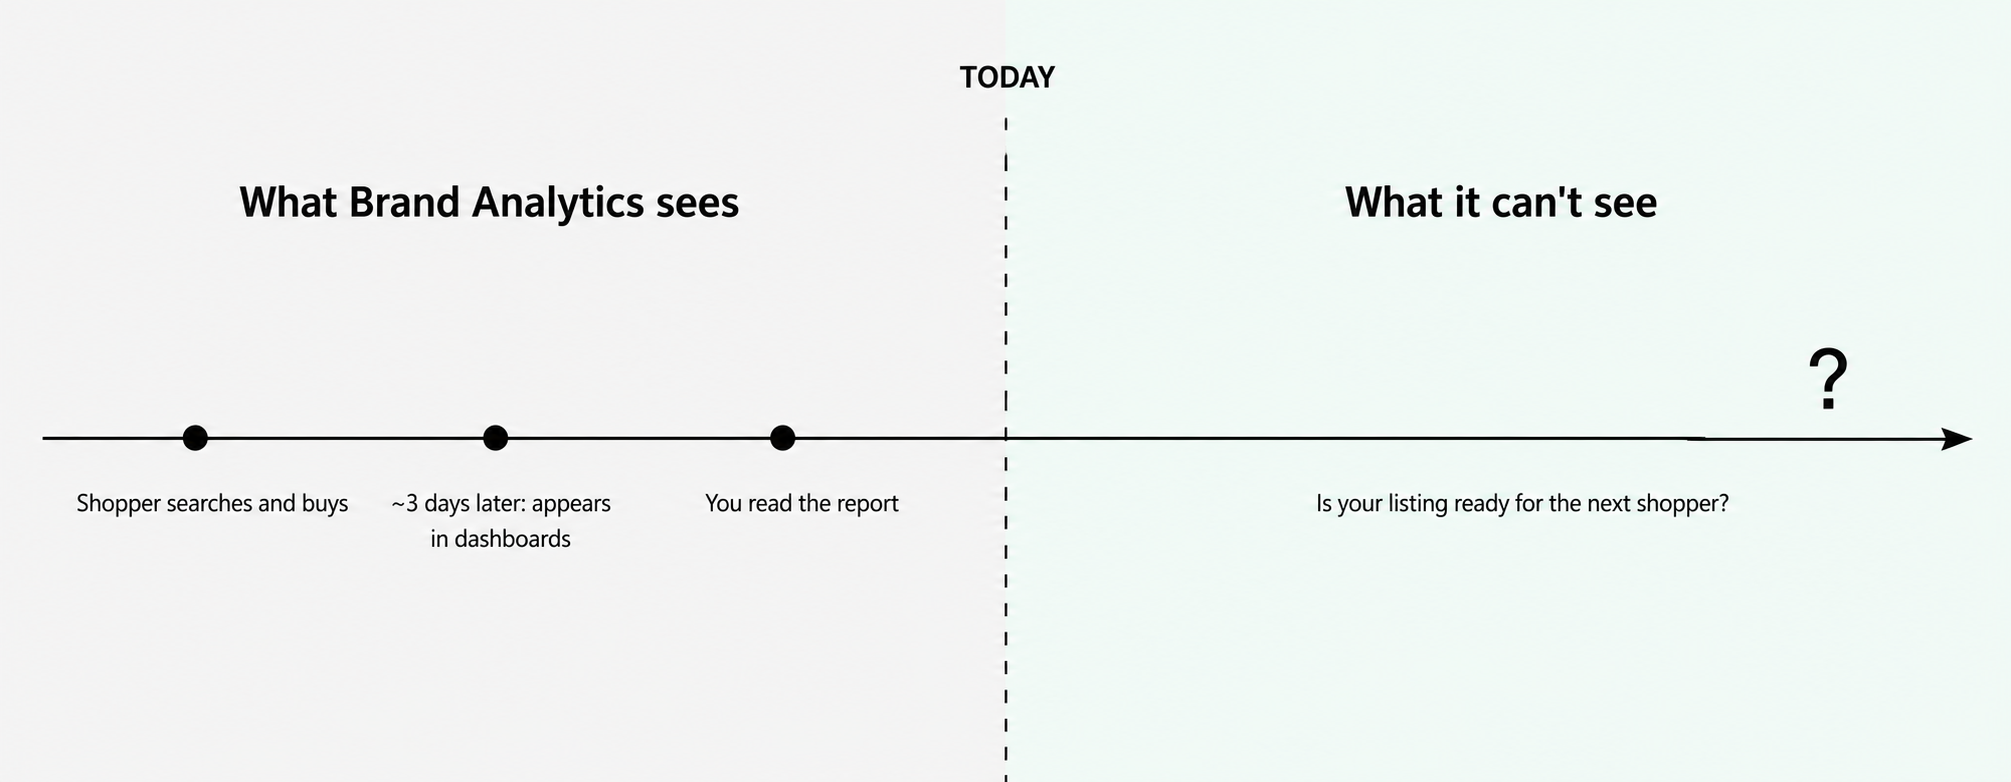
Two facts shape how to read the data. Most dashboards refresh within about three days, and brand history reaches back roughly three years. That is recent enough to act on and deep enough to spot a real trend. A number that swings week to week is noise. A line that bends over two quarters is a signal.
If your time is limited, focus on two reports. Search Query Performance drives the most decisions, because it shows not just which queries send traffic but where that traffic falls out of the funnel. Top Search Terms comes second, because it shows the queries with real volume and who wins them. Check the others monthly. Check these two weekly.
That is the honest case for Brand Analytics. The problem starts when you ask it a question it was never built to answer.
Search terms, purchases, baskets, demographics, funnels. All of it records behavior that has already finished. Brand Analytics is like a rear-view mirror - a great one.
But a mirror only shows where you've been, never whether your listing is built for how Amazon runs discovery now.
The mirror is also curated, and has blind spots by design. Amazon suppresses low-volume queries, so if you sell high-ticket, ultra-niche, or personalized products, whole stretches of Brand Analytics come back nearly empty. Thin data doesn't mean shoppers aren't searching. It means their queries fell under the reporting threshold - which happens to be exactly the long-tail, conversational territory where the AI engine now does its work.
On June 30, 2022, Amazon retired the combined Item Comparison and Alternate Purchase Behavior dashboard because usage didn't justify keeping it. Reports come and go at Amazon's discretion. The suite reflects what Amazon chose to measure about the keyword era, not a full account of your listing's health.
Which brings us back to the quiz this article opened with. You've walked all eight dashboards now. None of them has it. There is no column for whether your listing is ready for the way Amazon surfaces products today, because when these reports were built, Amazon had one discovery engine to report on.
Now it has two.
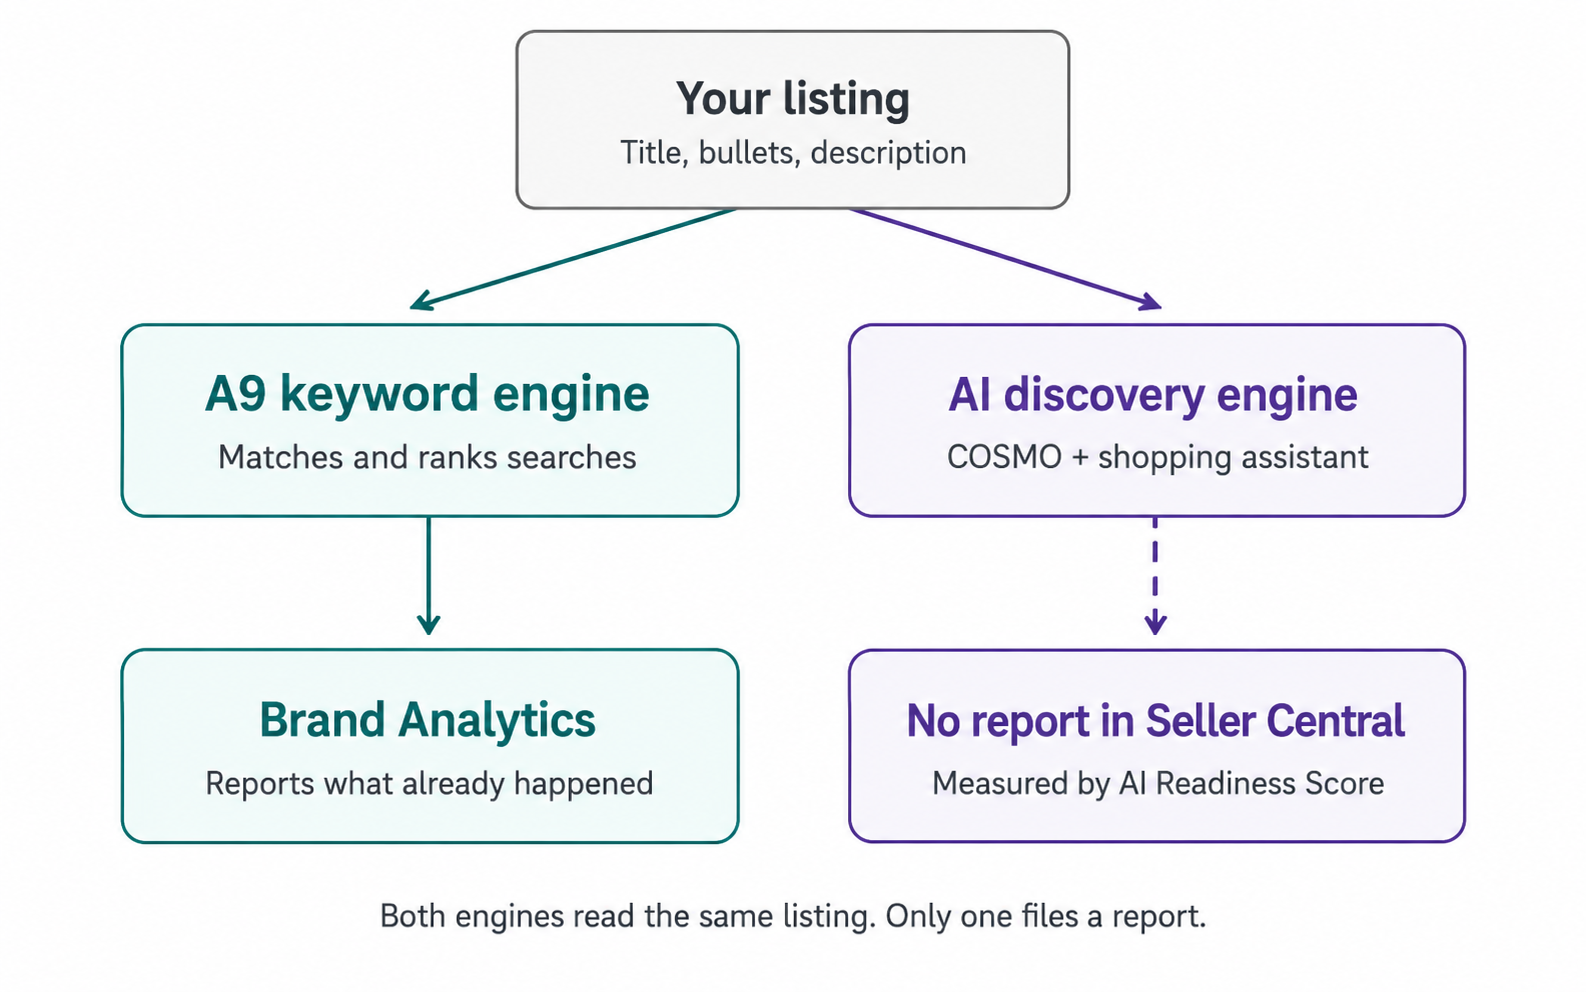
For most of Amazon's history, one system decided who got found. A9 matched a shopper's search to listings and ranked them, and it still decides organic rank today. Brand Analytics is, end to end, a report on what A9 did.
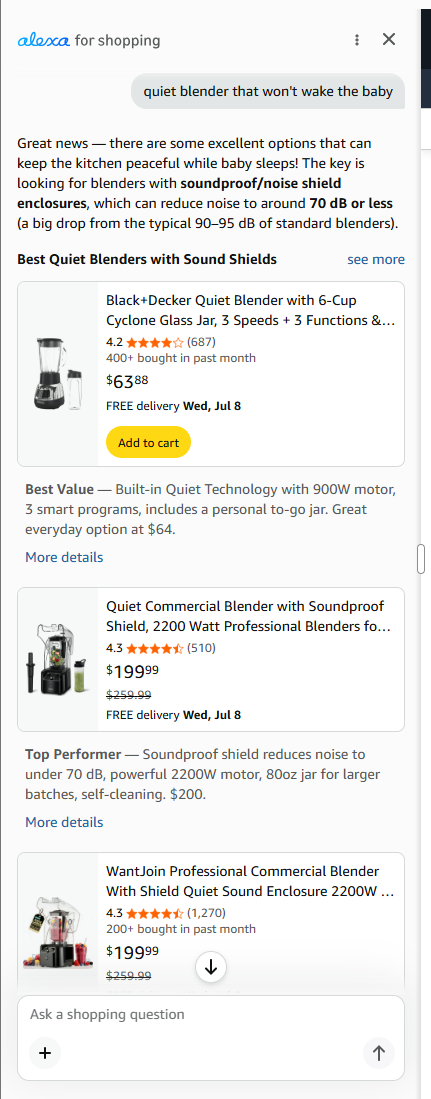
The second engine has been building since early 2024. Rufus, Amazon's generative AI shopping assistant, launched in beta in February 2024 and rolled out across the US over the following months. By 2025, Amazon says, more than 300 million customers had used it. Instead of returning a page of links, it answers shoppers directly. Someone asks for "a quiet blender that won't wake the baby," and the assistant reads listings, recommends products, and explains why.
Then came May 13, 2026. Amazon merged Rufus and Alexa+ into a single assistant called Alexa for Shopping and moved it out of the side panel and into the search bar and results page. The AI layer stopped being a feature shoppers had to seek out. It became the default surface a signed-in US shopper meets first, generating answers and comparisons before anyone clicks a listing. (Read our full breakdown of the assistant here.)
Why does this matter for your listing? Because to answer a shopper, the AI engine has to understand your product as structured knowledge: what it is, who it's for, what it pairs with, what problem it solves. That is the job of COSMO, Amazon's commonsense knowledge graph, published by Amazon's own scientists at SIGMOD 2024. COSMO maps listings as relationships between products, uses, and buyers rather than as keyword strings, and Amazon has confirmed it is deployed across its search applications. A listing stuffed with the right keywords can rank fine on A9 and still give the AI engine little to reason about, because the relationships aren't on the page.
Both engines read the same listing. One keeps you ranking. The other decides whether you show up when a shopper asks a question. Only one of them files a report in Seller Central.
This is why your dashboards can look fine while the business underneath them doesn't. The usual read on sliding sessions is a traffic problem, so you buy more traffic or rewrite the copy and wait. The reports seem to back this up. The funnel still moves and the search terms still rank. But the reports look fine because they measure the engine that isn't the problem.
Sellers feel this before they can name it. Amazon's seller forums fill, season after season, with the same story: sessions sliding for months with no listing change that explains it. The common response is to reach for a tool, often an AI copywriter. When sales don't move, the frustration points at something deeper. Without a repeatable way to score a listing against the engine that now answers shoppers, every change is a guess. You can't tell which fix produced which lift, prove the work paid off, or decide what to change next.
That measurement is the real gap Brand Analytics leaves open.
If you want to see what the AI engine can actually parse on one of your listings, ZonGuru's AI Readiness Score gives you that read in about two minutes. No account, no credit card.
Amazon doesn't grade your listing against its own AI for you. ZonGuru's AI Readiness Score exists to be that missing report: a free, 0-to-100 check of how well a live listing answers what Amazon's AI discovery asks of it. You give it an ASIN and it scores the two things the new engine depends on: how well your listing maps to COSMO's relationships, and how well it answers the questions the shopping assistant tends to ask.
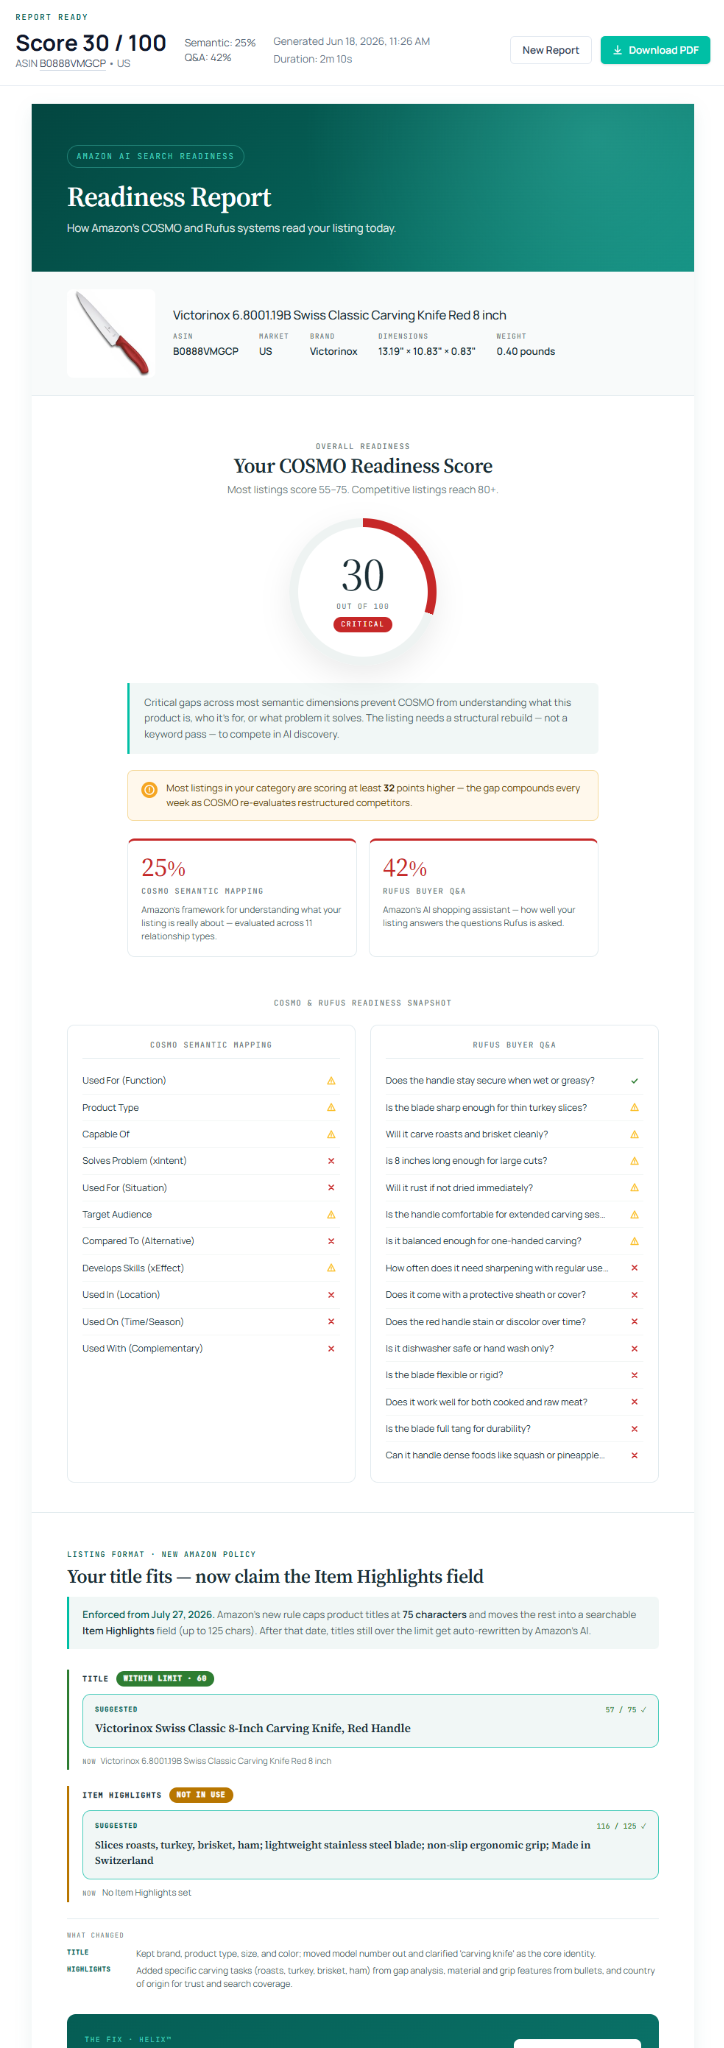
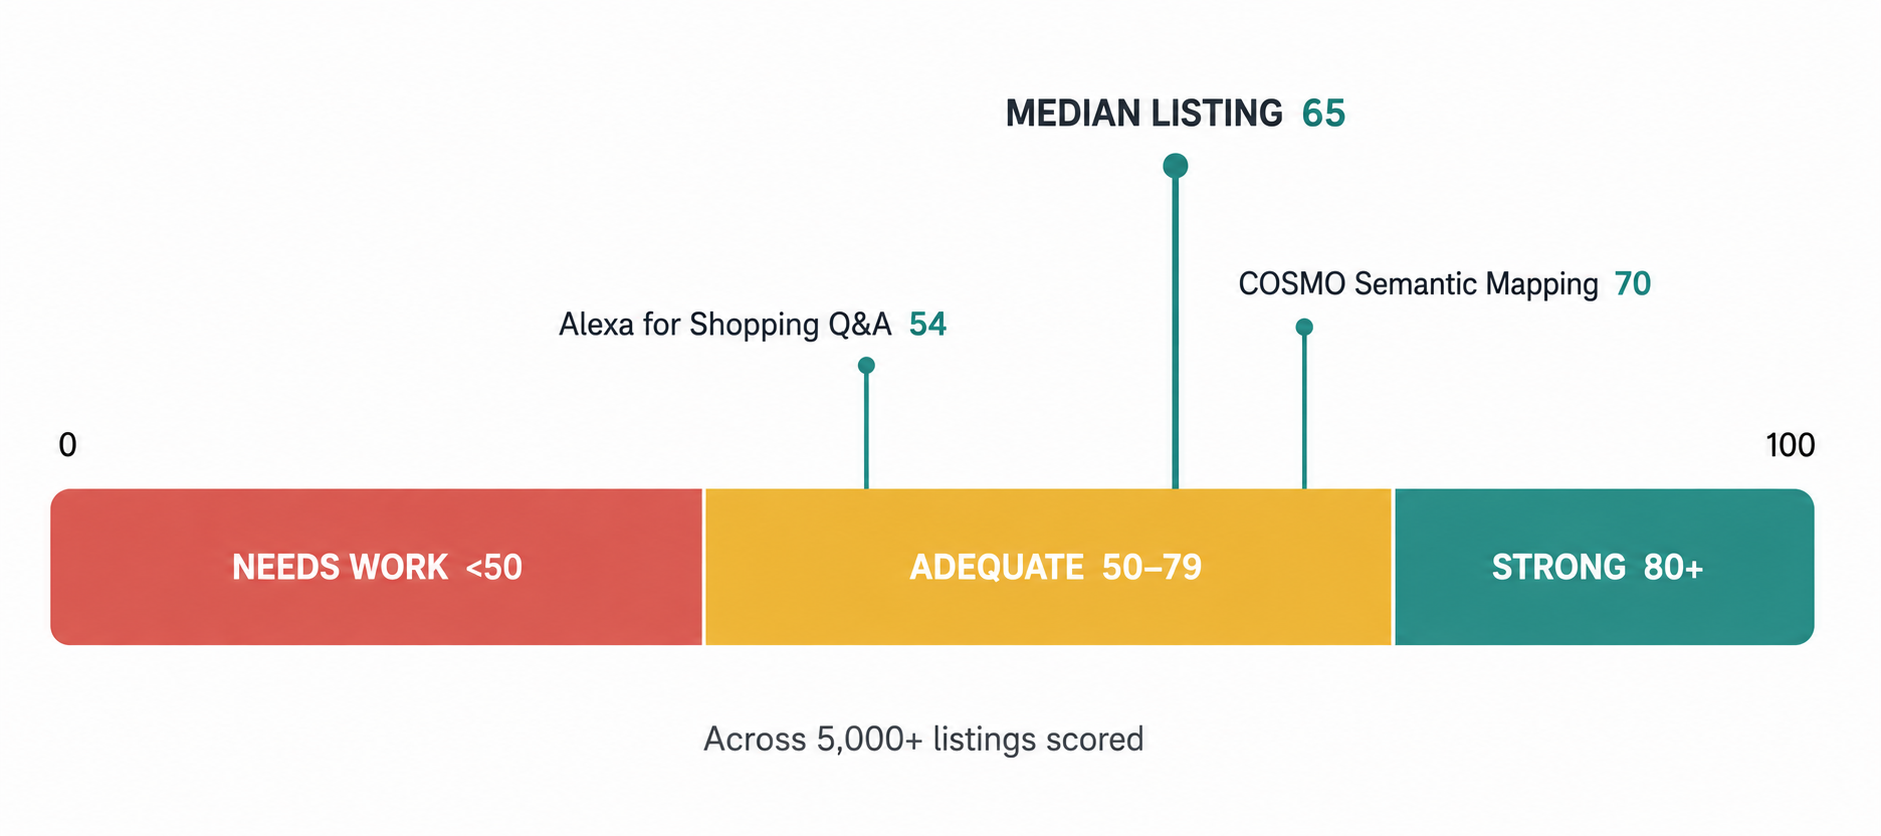
The numbers so far are worth sitting with. Across more than 5,000 listings scored, the median came back at 65 out of 100. The two halves split apart: the median COSMO Semantic Mapping score sits at 70, while the median Alexa for Shopping Q&A Coverage score sits at 54. Scores land in three bands: Strong from 80 up, Adequate from 50 to 79, Needs Work below 50. So the typical listing - keyword-optimized, ranking, healthy in Brand Analytics - is only adequate for the engine that now answers a growing share of shoppers, and weakest exactly where conversational discovery lives.
The Score doesn't replace Brand Analytics. It sits beside it and reads the engine the dashboards can't see. The dashboard tells you what your listing did. The Score tells you what it's able to do next. And once you have a number, engineering the listing to raise it becomes something you can measure instead of something you hope about.
One honest boundary: the Score reads your listing's text only. Title, bullets, and description, not your images or A+ content. It checks whether those words give both engines something to work with.
There is even a way to watch the two engines touch. After you raise a listing's Score, open SQP and watch your impression share on broad, conversational long-tail queries - the "quiet blender for the baby's room" phrasing nobody types twice. A spike there that your keyword work can't explain is most likely the footprint Alexa for Shopping leaves when it serves your product as an answer. Brand Analytics can't see the AI engine. But it can record the wake it leaves behind.
These tools answer different questions, and a serious operator runs both.
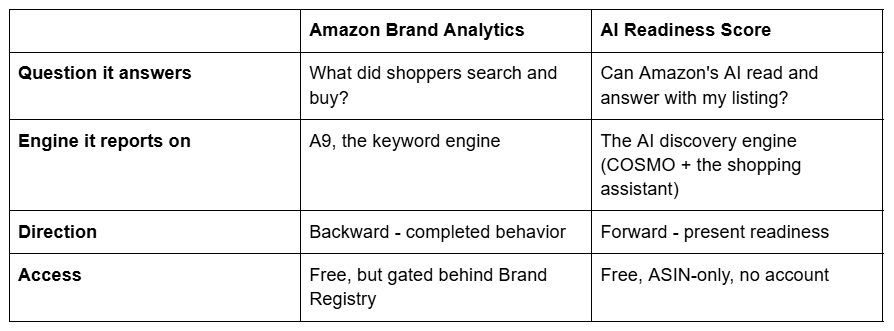
Sellers usually compare Brand Analytics to another dashboard, or ABA to Amazon's Vendor-side retail analytics. Another dashboard just gives you more backward-looking keyword data. The question worth answering in 2026 is whether anything shows you the present. Brand Analytics is the rear-view mirror. The Score is the windshield.
Keep using Brand Analytics. It is the best free record of how shoppers found and bought from you, and the Search Query Performance funnel will keep earning its place in your week. Just stop asking it a question it can't answer. A listing that ranks fine today can still be invisible to the engine answering tomorrow's shopper, and that engine doesn't file a report in Seller Central.
The fix isn't a better dashboard. It's a number the dashboards don't carry.
See where your listing stands - run your free AI Readiness Score on your best ASIN. We analyze only your public listing data, charge you nothing, ask for no credit card, and never send spam.
Is Amazon Brand Analytics free? Yes. There is no separate charge for Brand Analytics. It is included for sellers enrolled in Amazon Brand Registry with a Professional selling account. You're already paying for the program that unlocks it.
Do you need Brand Registry to use Brand Analytics? Yes. Brand Registry itself requires either an active registered trademark or a pending trademark application for your brand, plus brand-representative permissions on the account. Resellers and sellers without their own enrolled brand can't access it. The data is reserved for the registered brand owner.
What's the difference between Amazon Brand Analytics (ABA) and Amazon Retail Analytics (ARA)? They serve different selling models. Brand Analytics is for sellers on Seller Central, meaning third-party brand owners running their own listings. Amazon Retail Analytics is the Vendor Central counterpart, for brands that sell wholesale to Amazon as a first-party supplier. Same instinct, different data and different account type.
Can Brand Analytics tell me if my listing is ready for Amazon's AI? No. Every Brand Analytics report reads the keyword engine's history. None scores whether your listing's text gives the AI discovery engine something to reason about. For that you need a direct read of the listing, like a free AI Readiness Score, which checks the COSMO and assistant-readiness layers the dashboards don't touch.
Discover opportunities. Maximize your sales. Grow your Amazon business!

Free score in 2 minutes. See how Amazon's AI reads your listing and what to fix.
 Run my Free Score
Get started with ZonGuru, access all the tools with a FREE trial.
.webp) Start FREE Trial
Start FREE Trial